Taking a look at local land use.
Recently I blogged about Rewilding and the amount of pasture used for horse grazing. Having focused my mind I decided to take things a stage further, so I printed off a OS1:25000 scale, which I had zoomed in on and selected to cover approximately 12 square Kilometres in an area close to my home.
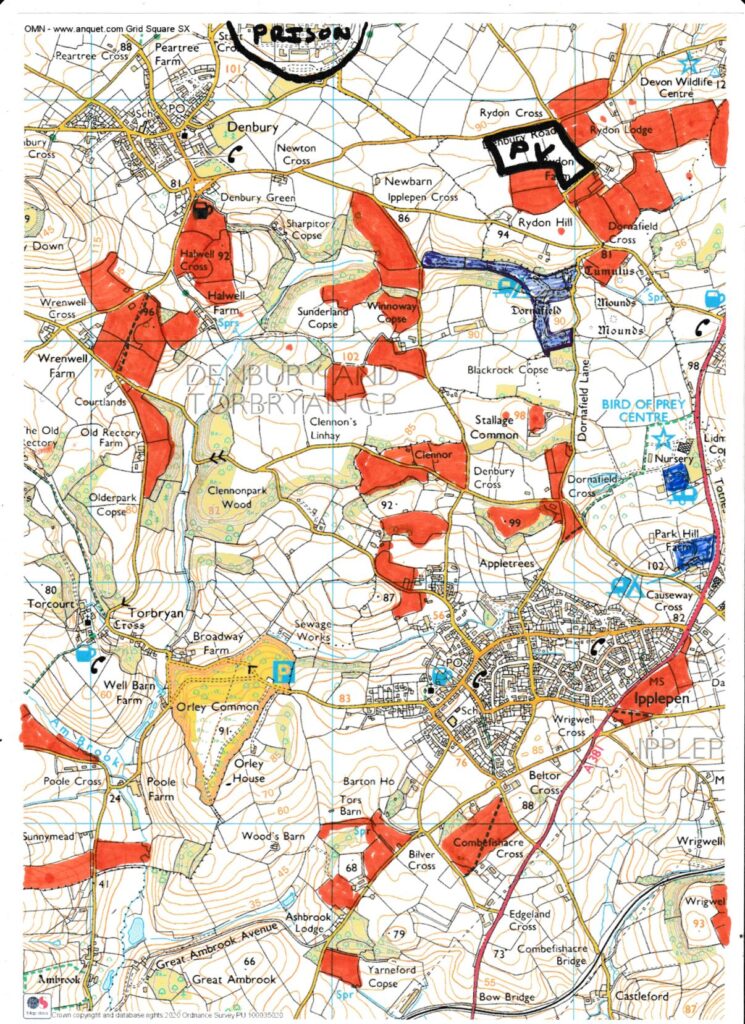
My next step was to colour in all the fields I knew were used for horses in orange. Using Google Earth I then viewed the area and realised that there was an erosion pattern for horse grazing that made other fields easy to spot. I marked each field I suspected with an orange dot, and then worked all my daily dog walks and bike rides out in such a way that I could view and check these locations and fill them in when confirmed. There are, I suspect a couple of horse paddocks I’ve missed, but the result is a fairly complete survey and good enough to get a rough impression of the land use in my area.
So when you look at the map, it’s not hard to gauge that the built environment of Ipplepen, Denbury and the prison jointly account for at least a square kilometre in area, and probably a kilometre and a half. That leaves about 10.5 kilometres square for productive use. Now during the process I started to notice a few other things taking up space in the landscape, including some substantial fields of photovoltaic panels, a fish farm and a caravan site. The field of panels is not grazed, so not productive in a food context, and I don’t think the fish farm is currently operating, and may be more recreational. So taking those areas into account, we have about 10 sq K left.
The next thing to come under the microscope is the woodland, and this one is surprising: when you drive through Devon, it feels well wooded, with high hedges and plenty of oak and ash woodland either side. But when you look more carefully you realise this is smoke and mirrors! The tree cover does tend to follow roads, but it is far less deep than it seems to the casual observer. In the case of my map the Ordnance Survey has depicted the woodland a bit over generously, and I would estimate that the total of all the tree cover shown might be 2 square Kilometres, leaving 8 sq K for food production. However when you look at the way O.S. have depicted the woodland edges, many are not fenced from grazing land and my site inspections showed that many of these were stands of mature trees, grazed below and with minimal understorey or regeneration….so these are deteriorating habitats. Another aspect of these woodlands is that they have survived for a reason. Almost without exception the woods contain rocky limestone outcrops, old lime kilns and quarries that have made the ground unsuitable for most farming practices. The woodland often represents vestiges of coppicing, possibly for firing the kilns. So it seems this woodland has effectively survived because no one much wanted it, rather than due to active management. There are one or two exceptions: old orchard, a bit of plantation and an area where woodland has grown up on a significant archaeological site. There is one more point I would make about the woodland, it will be where much of the local wildlife, especially mammals and birds are hiding, but these woodland areas are very patchy, and they are poorly joined up. There are lots of hedges, but most are extensively flailed and offer little cover and limited habitat opportunities. Improving these hedges would benefit the connectivity of the woodland areas.
So back to our productive land….about 8 square Kilometres, this is mostly on limestone geology, much of it has thin soil cover, and almost all of it is grazed rather than cultivated. From the map you can see that horse grazing accounts for something like 2 square kilometres (going by eye) leaving just 6 square Kilometres, half our original area to be divided fairly equally between sheep and cattle (both beef and dairy varieties).
Now of course, this is all very approximate, but that is not the point. The process gave me new insights into my local area, a clearer understanding of what is (and isn’t) there, how it is being used and in some cases what to expect to happen if nothing changes. I’d recommend this exercise to anyone in Covid lockdown who wants to do something constructive with their daily exercise and understand their environment better.

Hi, that is interesting. I live nearby and am connected to Action for Climate Change Teignbridge, we have been looking at how much land is covered by orchards, old, disused, falling down, or well kept, as they are some of the best habitat for biodiversity locally apparently, so should be preserved. Would also be interesting to do the same mapping for hedges – big, wide, dense, Devon hedges which are also good habitat.
Best wishes
Marian
On my map remnant orchard is focused on the settlements…Denbury, ipplepen and Torbryan, very little left in hinterlands and almost none of it in good condition.